System Diagrams

The following are system diagram presented in information visualization-style plates. They dissect everyday systems from application models, feedback loops, and user-function conceptual models of everyday tools. They are a result of observations and research from the things I see.
This page is mobile friendly, however due to media rich content tablet or desktop viewing is recommended.
*The diagrams are a lightbox links, so feel free to click and zoom the image if you want to take a closer look.
Application model: image processors
Above is a simplified visualization of how raster-based image processors work and how they write and store information. Essentially, the canvas is divided into a grid depending the pixel count (which is the size of the canvas). Each pixel is given a set of hexadecimal numbers which indicate the color value. Information is saved in the file in a similar way, with the header and footer indicating the information of the file (i.e file type, size, metadata), and the meat of the file which is said hexadecimal values.
Feedback Loops
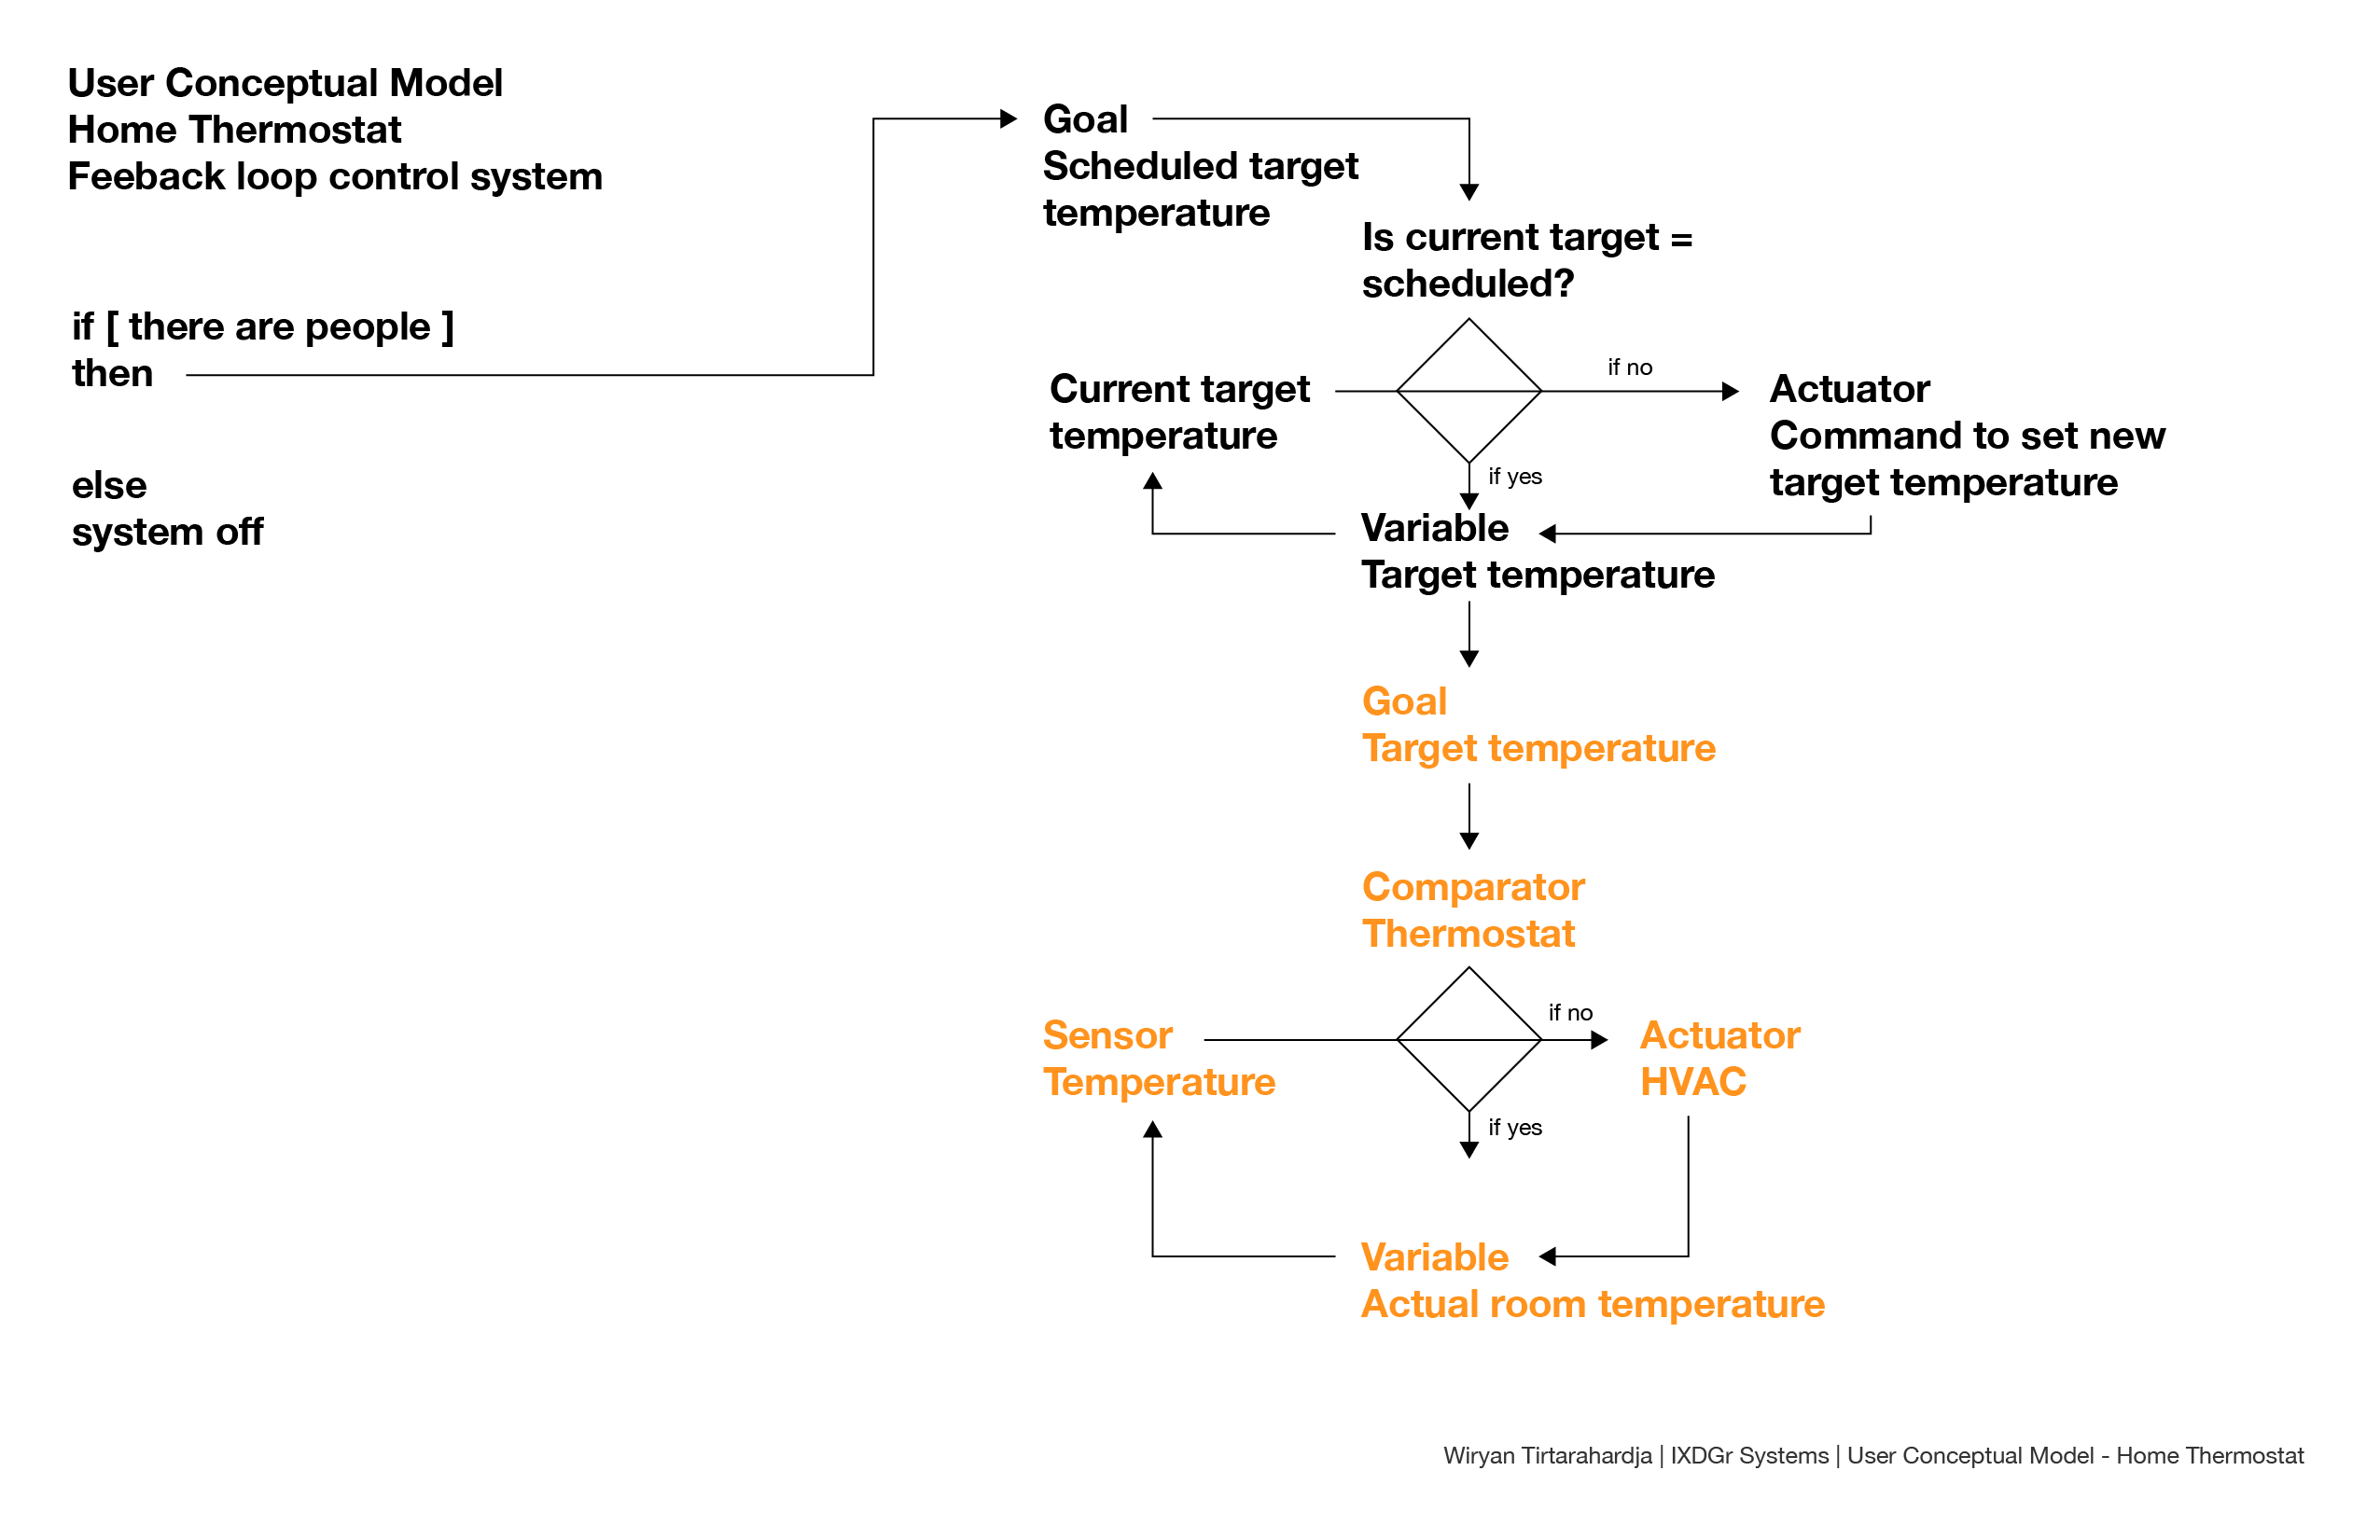
Feedback loops are one of the basic building blocks of automatic controls and regulations. They are designed to maintain something at a desired state. The components of the systems are: sensors that measure the current state of a significant variable, a comparator that compares the variable and desired state and what to do, and an actuator that the comparator commands to affect the current state.
Aircraft fly-by-wire as a feedback loop
An example application of a feedback loop are modern aircraft fly-by-wires. Modern aircraft are essentially flown by a flight computer, where the pilot tells the aircraft what they want to do, and the computer actuates flaps, engines, and so on to achieve the desired state. Back before the 70s apparently, when the original 737 was first designed, there are actual wires and hydraulics that physically connect the pilot's yoke or stick to the flaps on wings and stabilizers.
Of course, being an aviation nerd I watched hours and hours of video analysis and NTSBĀ reports over what caused the accidents. In the end its was a failure of one of the components that made up the feedback loop. Essentially it was a sensor that reported the wrong attitude of the aircraft which led the flight computer to assume the wrong state of the aircraft. But this is only one aspect of the disaster, the result of cramming a late 1960s design with bigger engines, and a patchwork of computer systems to keep it relevant in the late 2010s, and massive oversights. Ultimately, it led the approval of an aircraft which did not have appropriate means of sensor redundancy.
Acknowledgements:
NYTimes - "Boeing Built Deadly Assumptions Into 737 Max, Blind to a Late Design Change", 2019
Function conceptual model: home thermostats
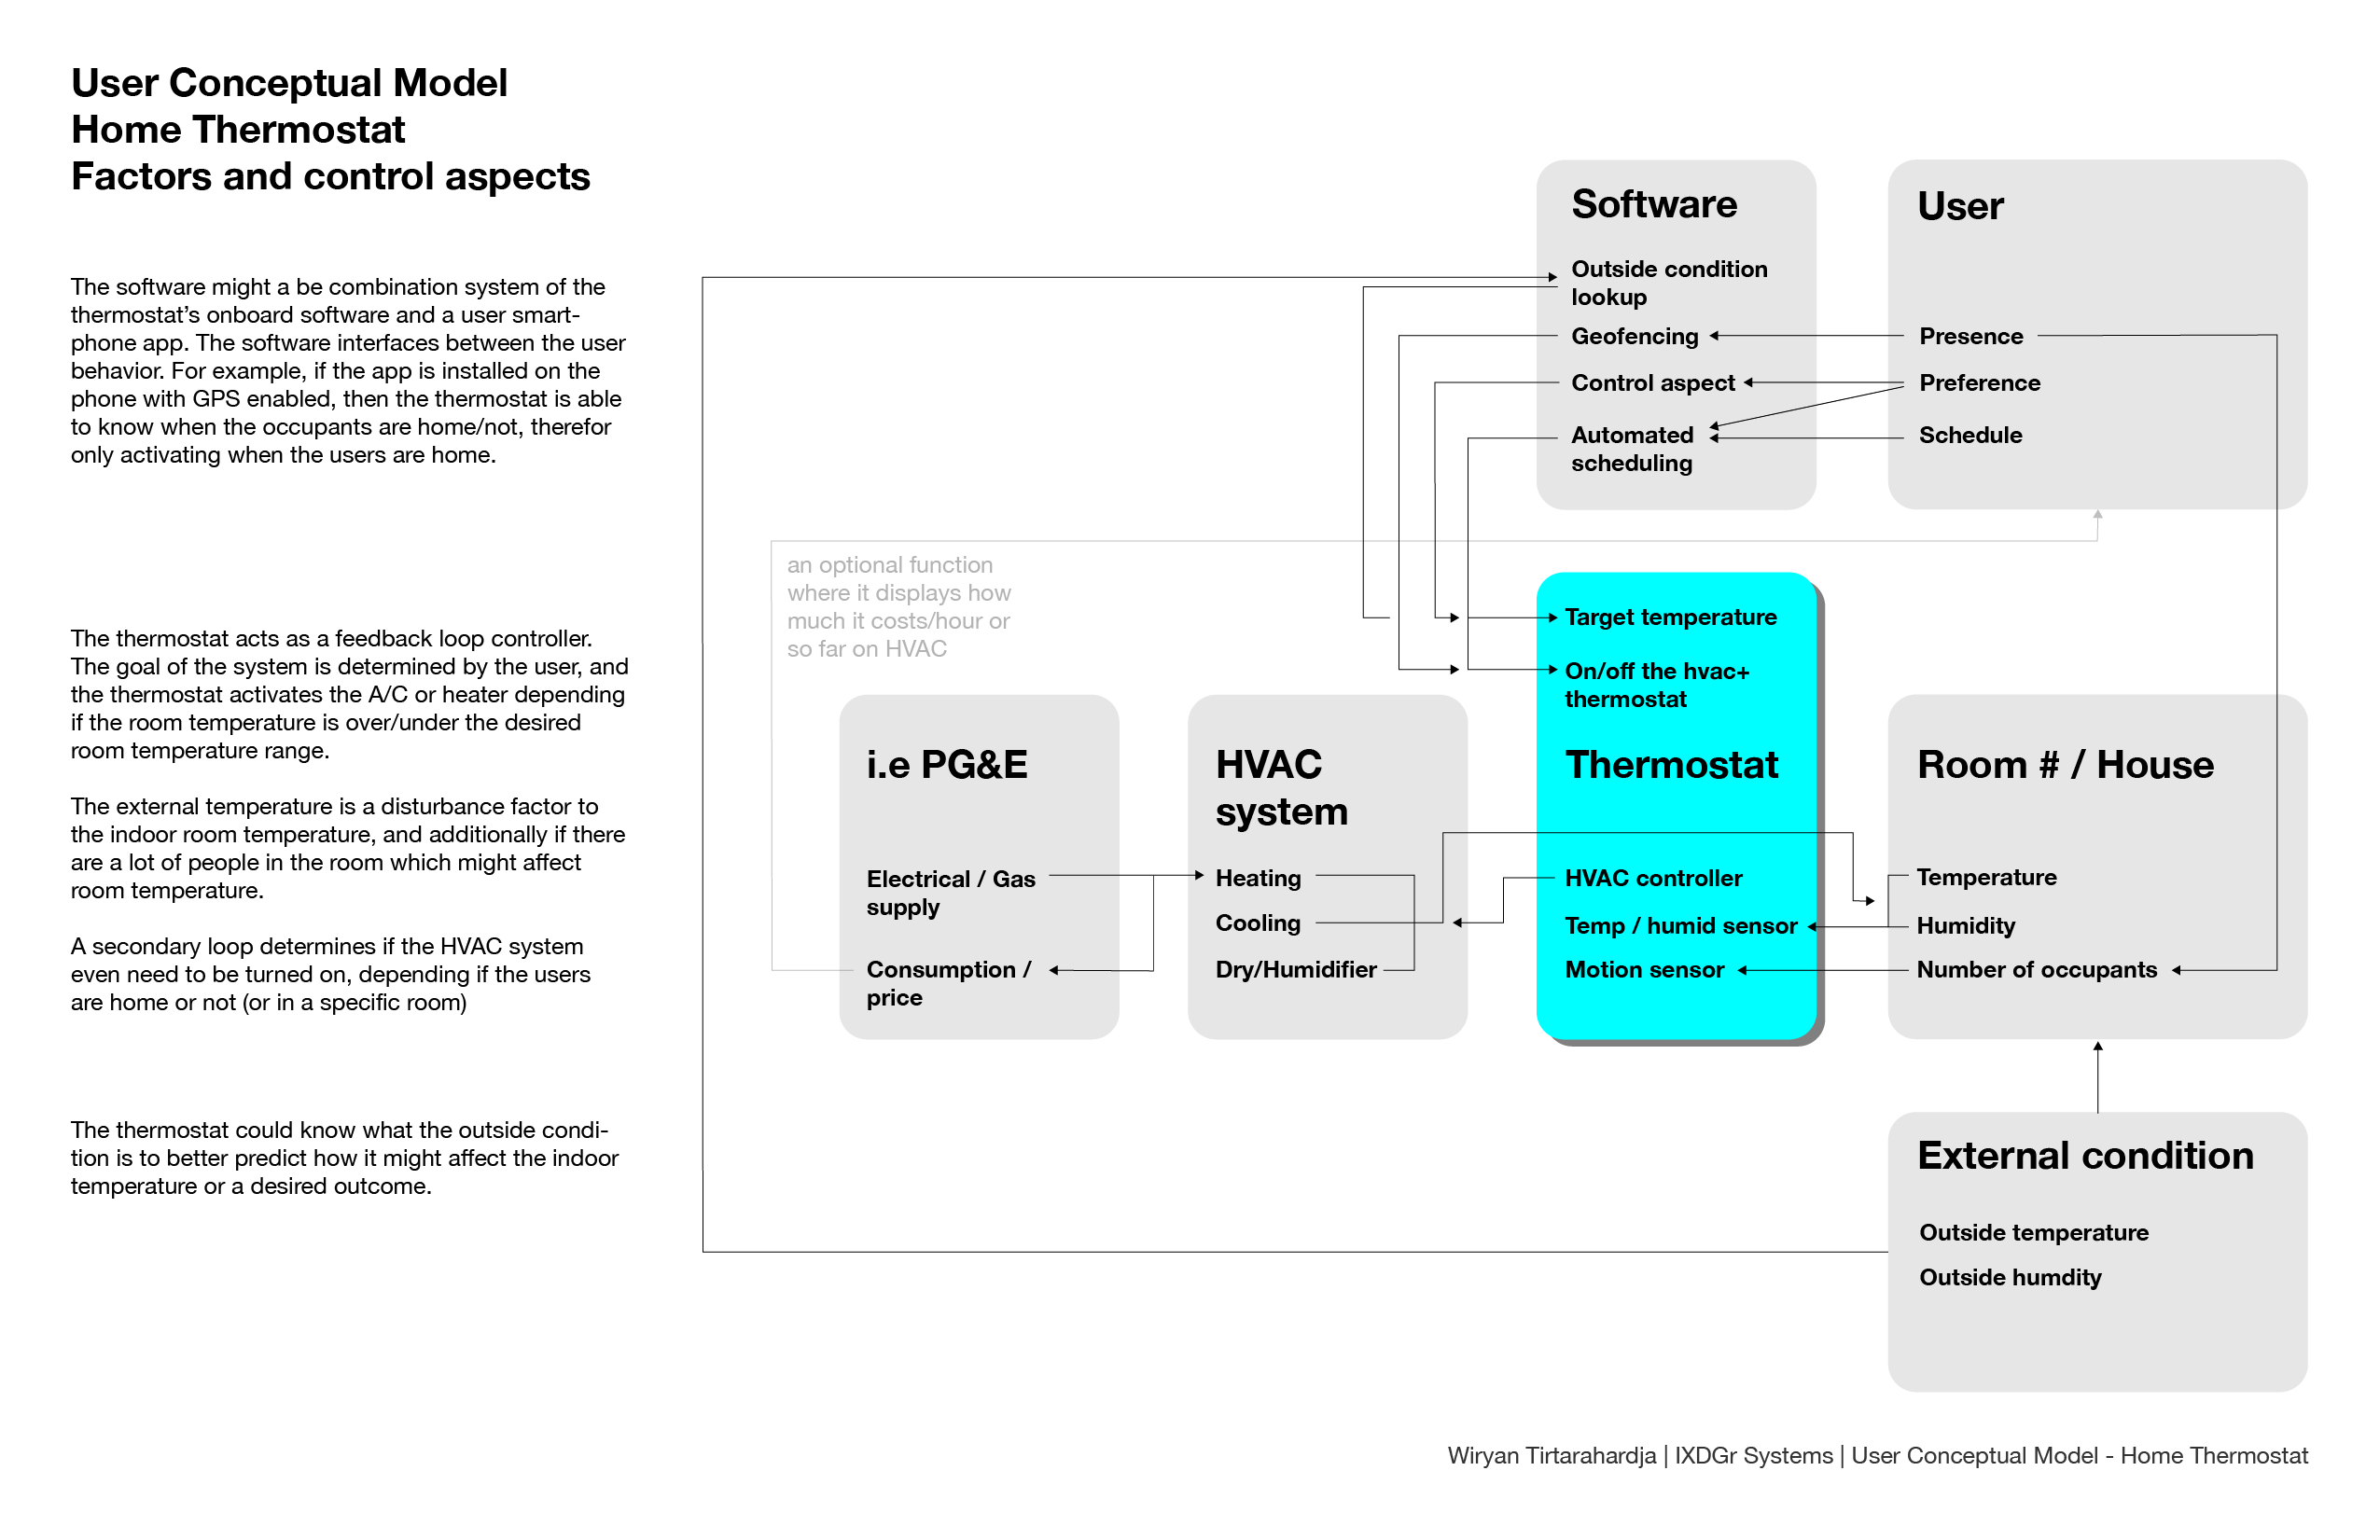
A thermostat is in its core a feedback loop. However, modern thermostats have complexities that determine when to initiate control, what is the desired temperature state, and other rules that govern the system from occupancy, user preferences, and even ecological-efficiency rules.
The relationship of said elements govern the outcome of the desired state in a feedback model. Often, it could be a multi-level feedback loop where an element of the feedback loop function is part of an overall larger feedback loop. Or it could be an override where alternative feedback loops could be engaged.
The conceptual model translated to UI elements
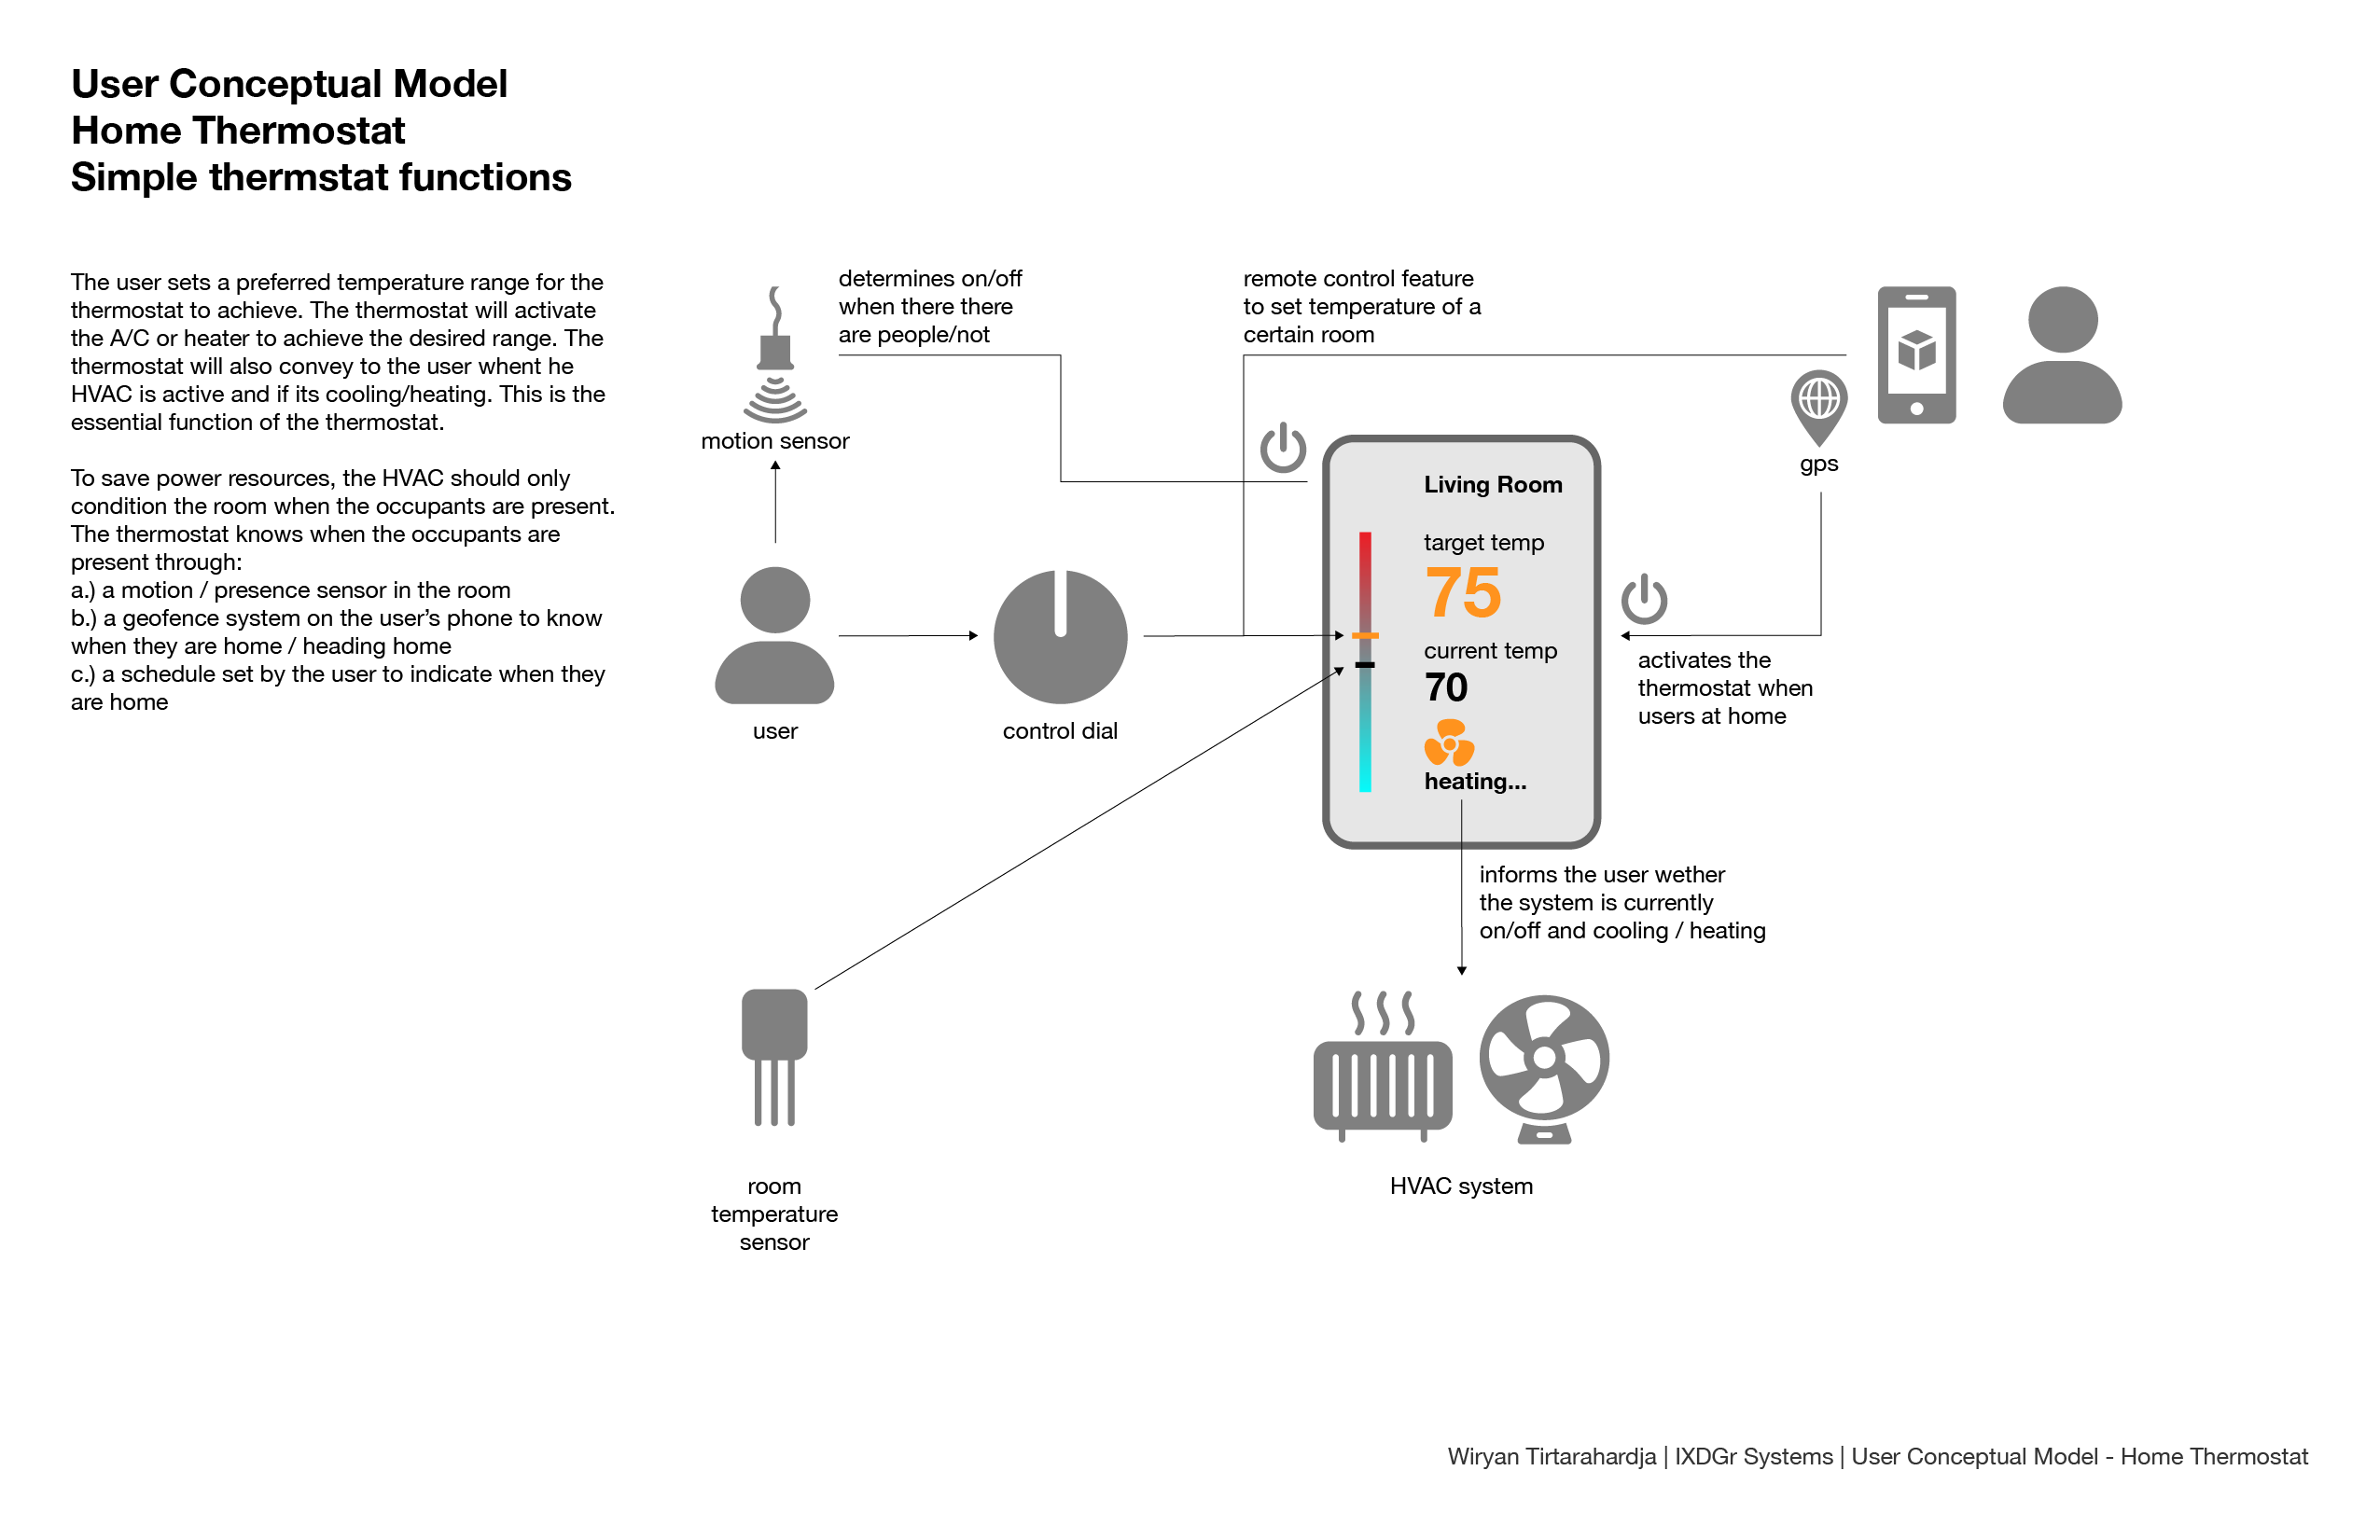
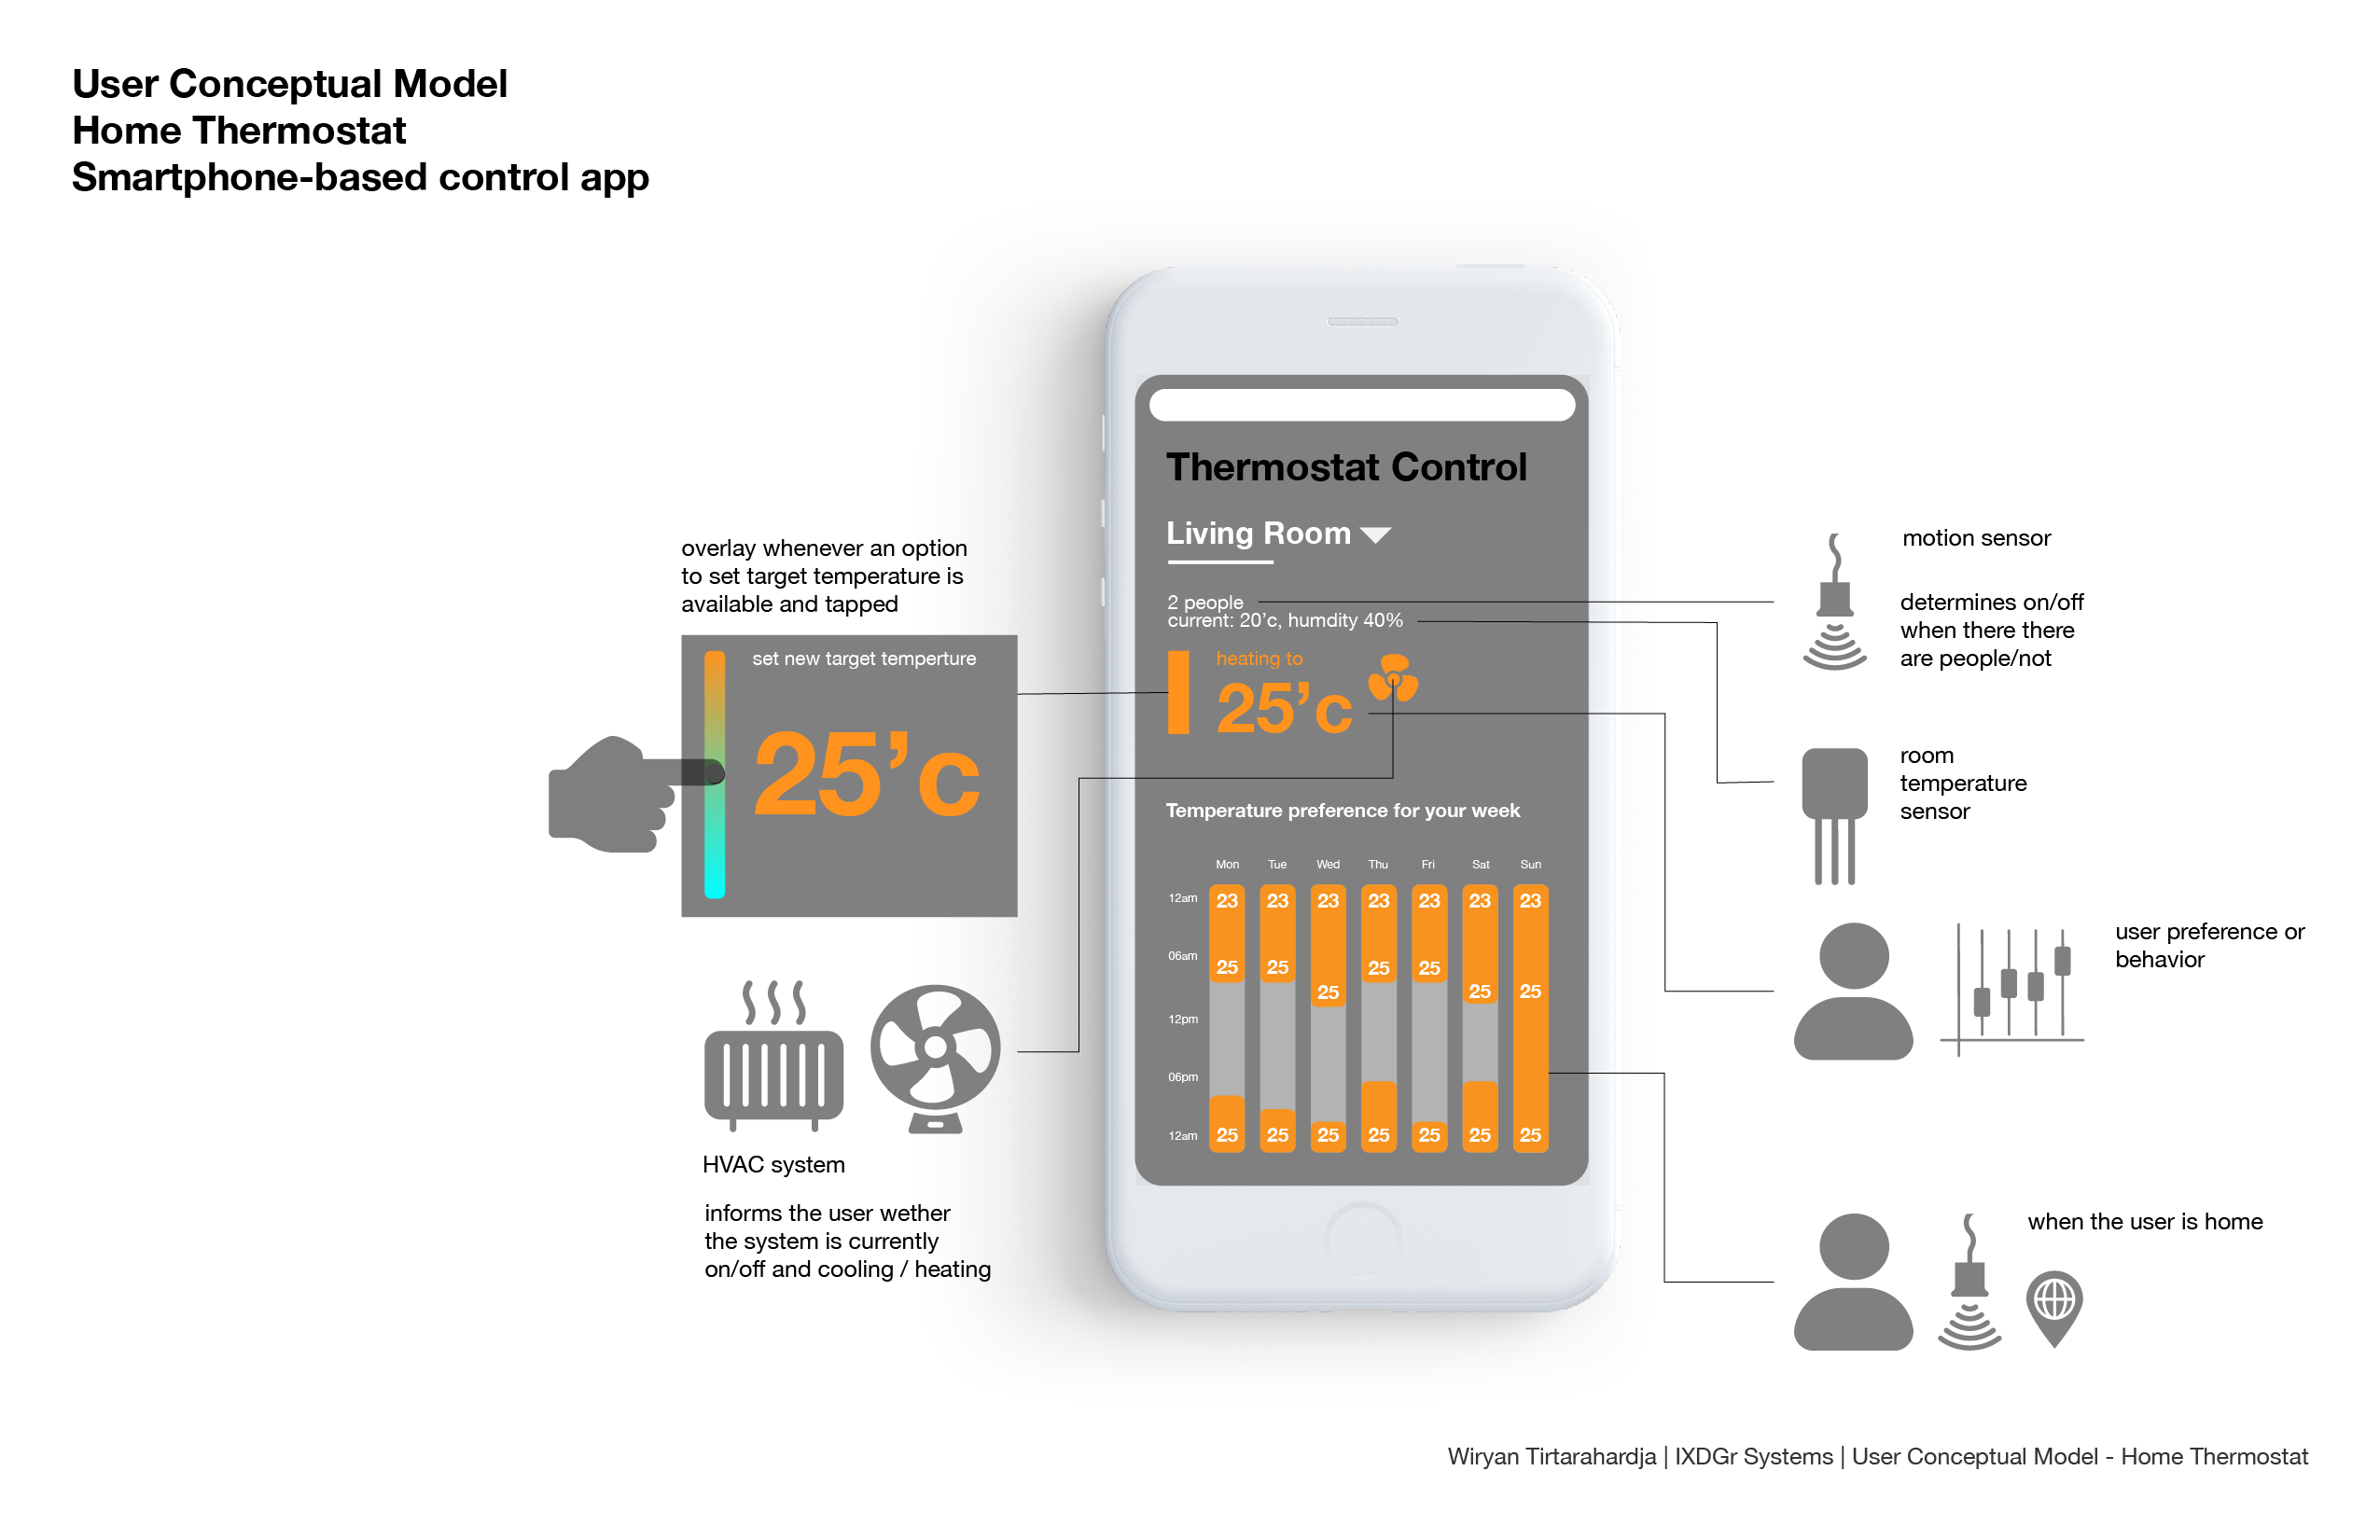
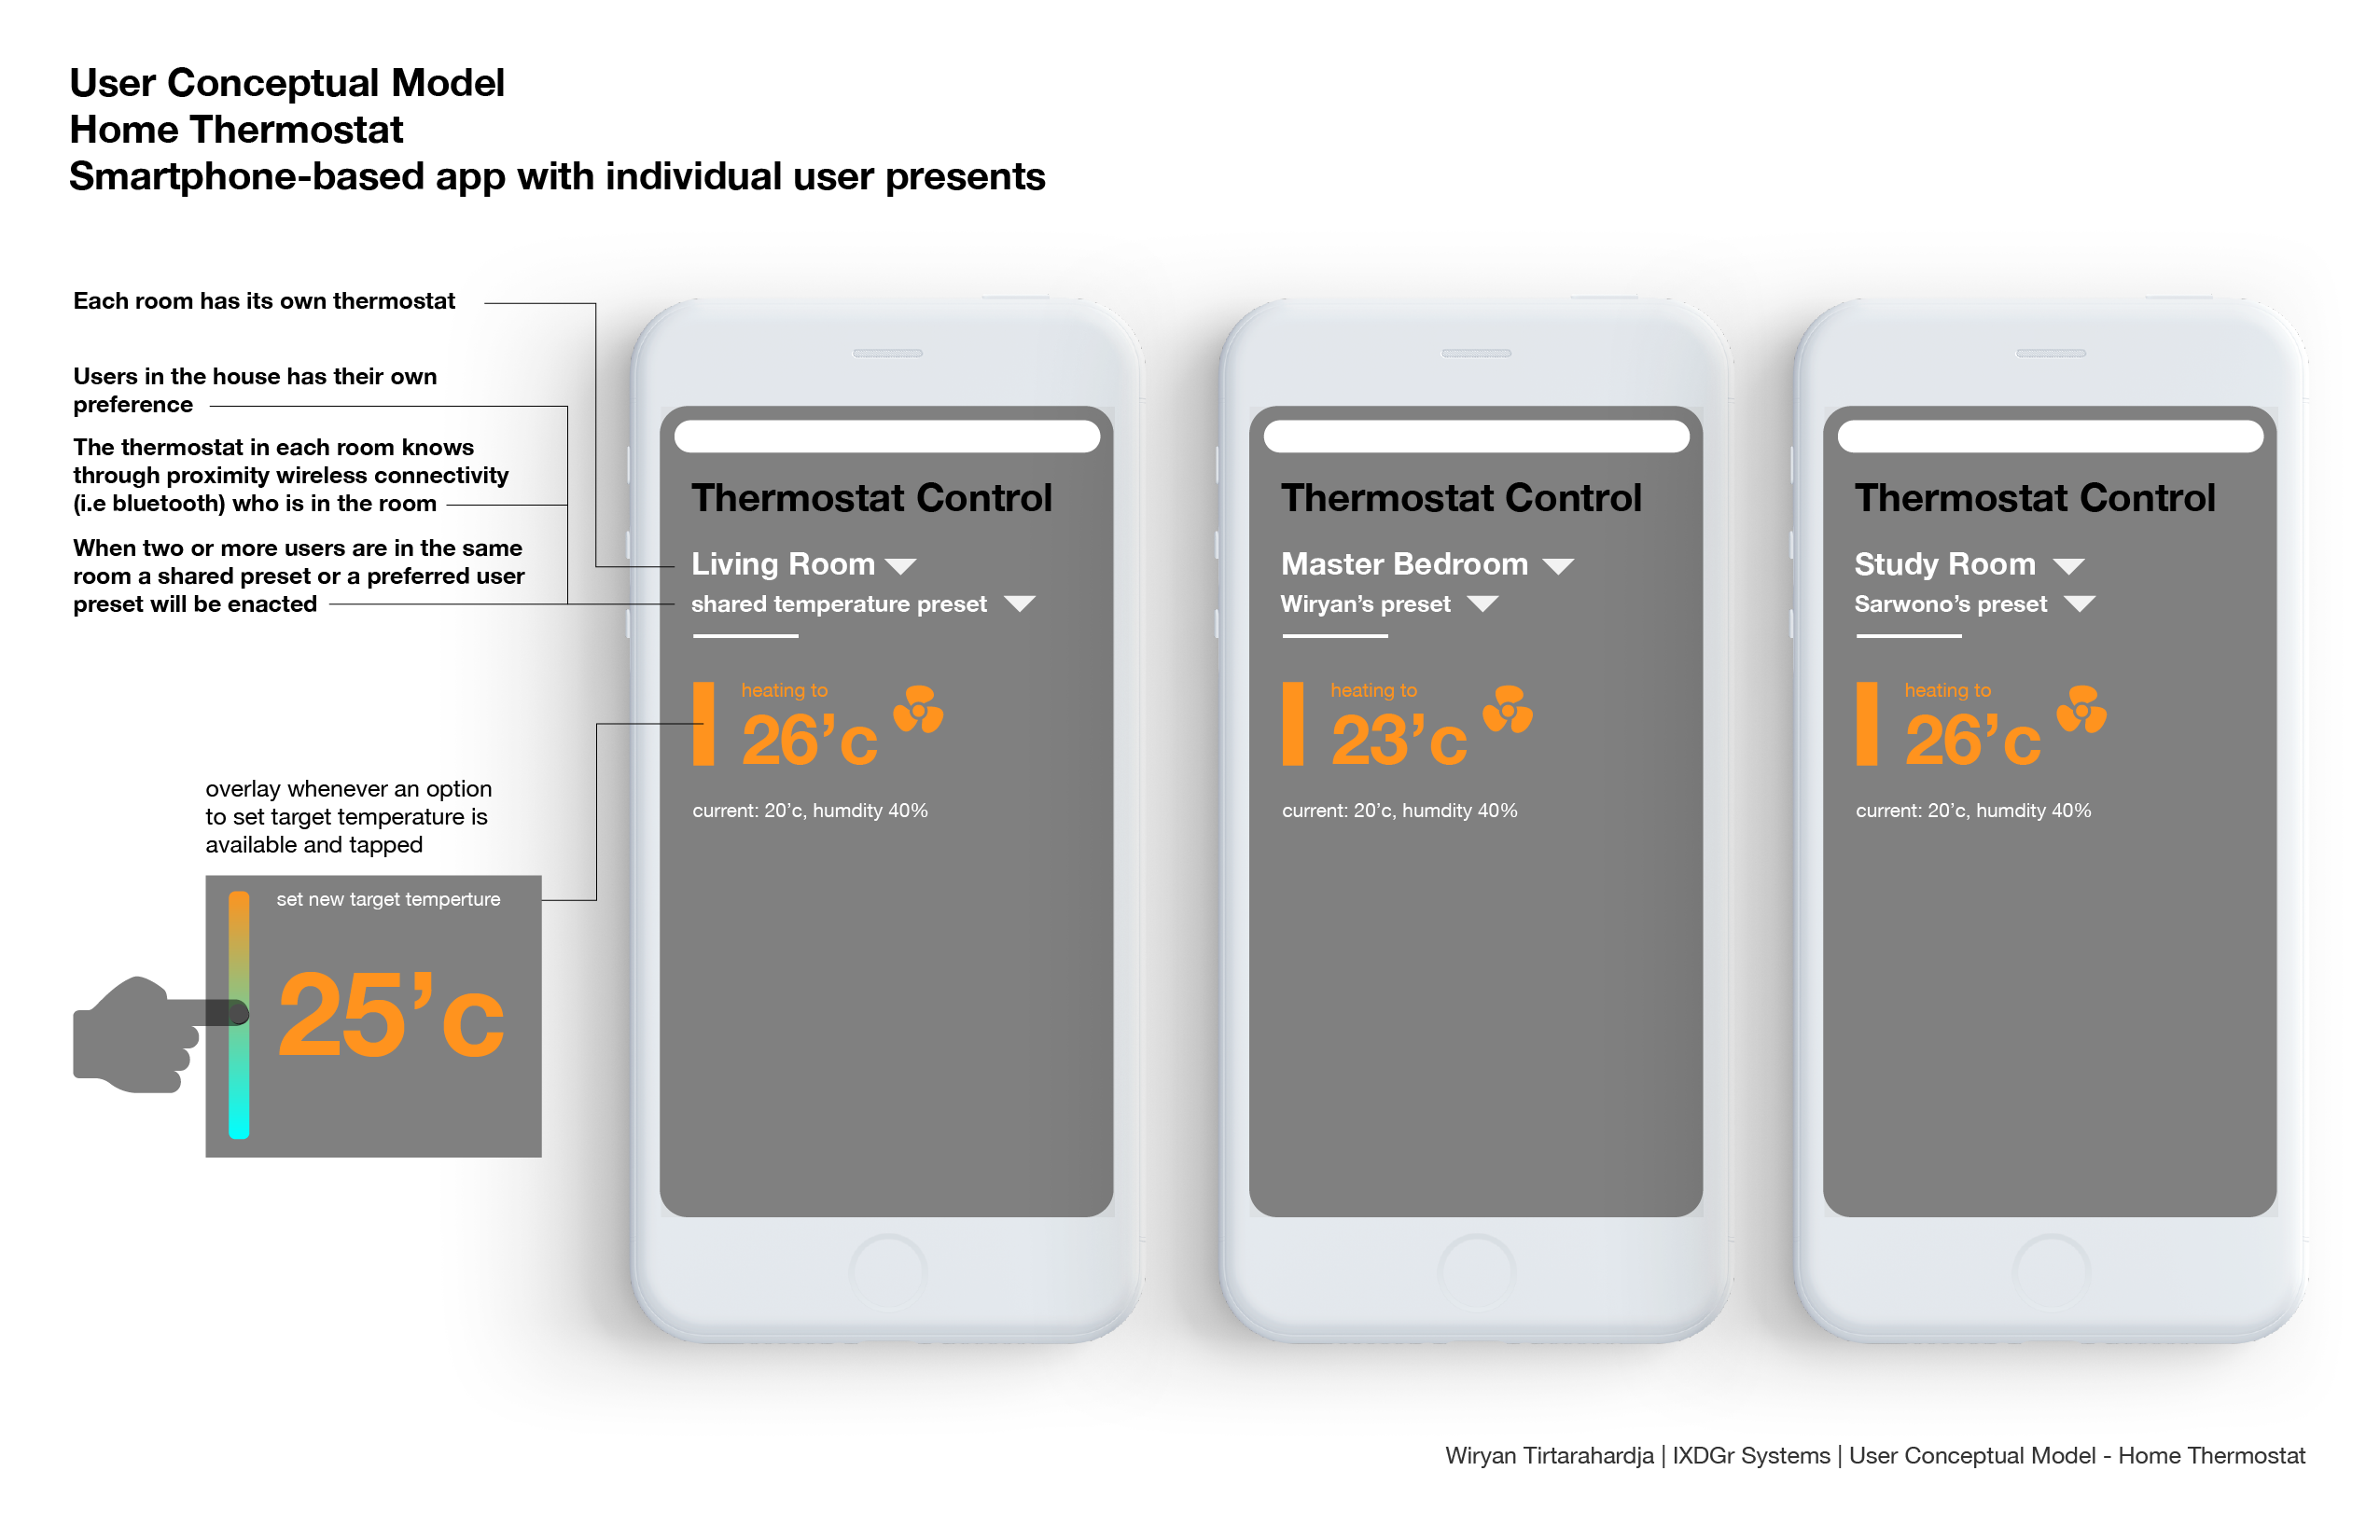
What goes onto the UI of a modern thermostat can be traced back into what the thermostat needs to connect and its functions.
An example system where the thermostat has the ability to sense presence of individual users within each room and daily temperature preference by the hour.
Hey there, I'm also looking for opportunities as well!
You can reach me at wiryantirta@gmail.comLinkedIn
Powered by Webflow